Query and visualization of the country distribution of confirmed COVID-19 cases
A mini tool that can check COVID-19 cases.
Introduction
The COVID-19 pandemic has profoundly impacted our daily life, generating vast amounts of data across various media. Given the limitations of human cognition in processing such large-scale information, structured query language (SQL) provides an efficient solution for data organization and retrieval. This mini-project focuses on two key functionalities:
- Identifying the country with the highest cumulative confirmed cases as of a specified date.
- Visualizing the number of cases in key countries using an interactive heat map.
By integrating SQL with a direct manipulation user interface and data visualization tools, the project facilitates intuitive data exploration and knowledge extraction.
Software Design
The software features a direct manipulation interface, developed using Python’s pygame and pyecharts libraries. Users can launch the software through various applications (e.g., command prompt) and interact with a simple interface.
- Upon launching, the interface presents a prompt and a button, allowing users to enter a date in the
YYYY-MM-DDformat. - After submitting the date, the software returns the country with the highest cumulative confirmed cases up to that day, along with the corresponding case count.
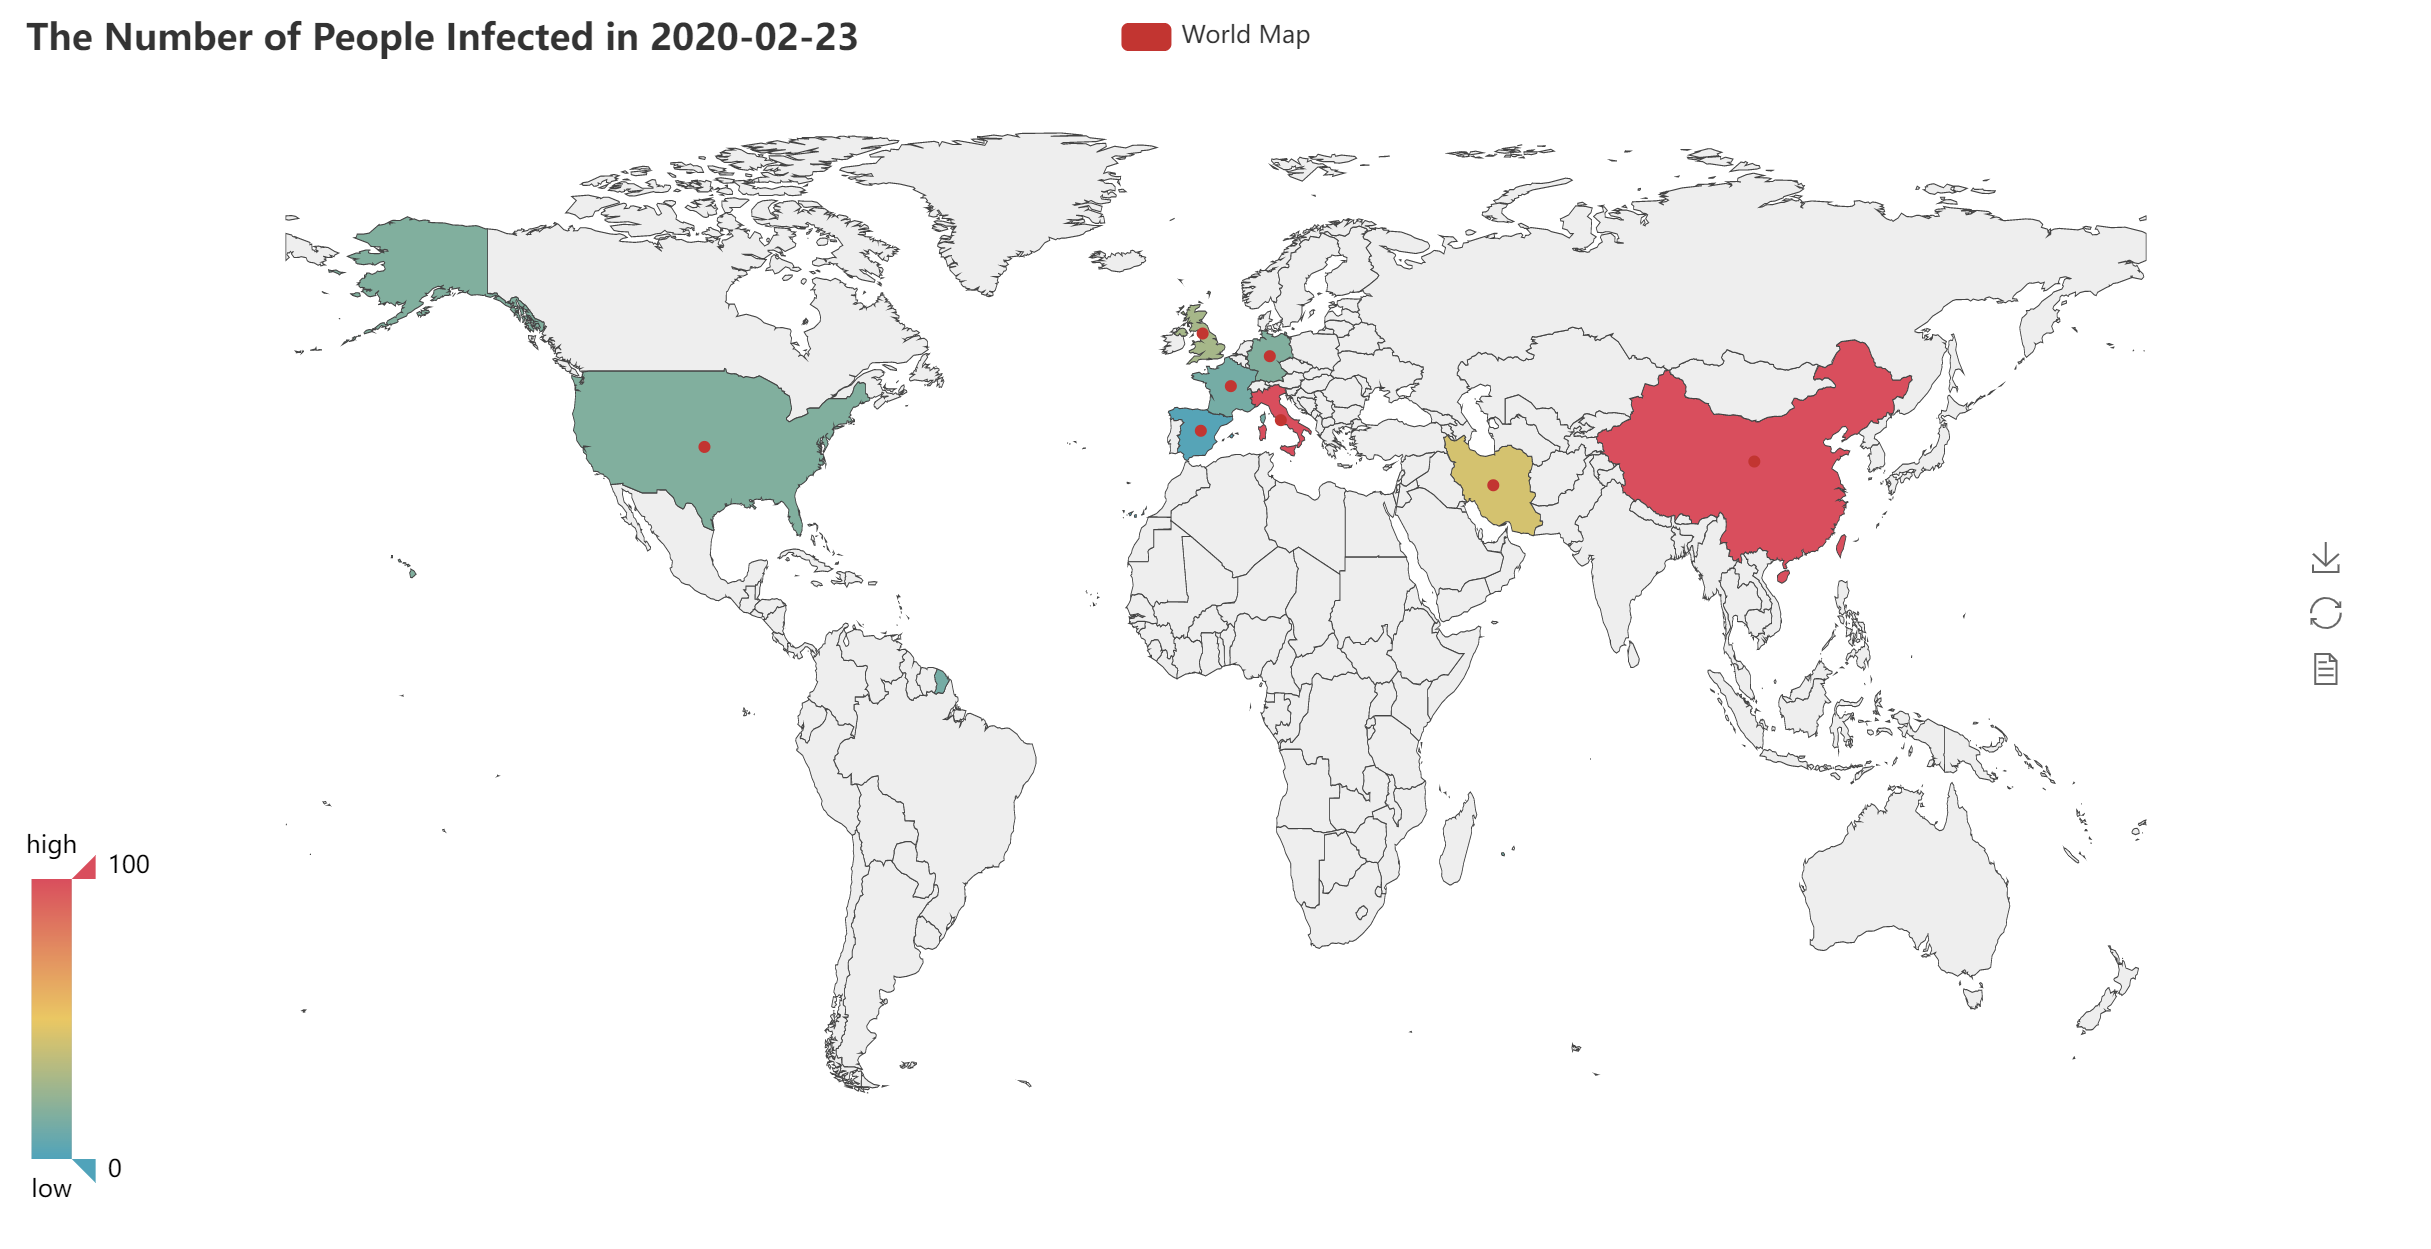
- Additionally, the software generates an HTML-based world map (as illustrated in Fig. 1), visually representing COVID-19 case numbers in key countries: China, the US, the United Kingdom, Italy, France, Germany, Spain, and Iran.
 Figure 1: Heat map of COVID-19 cumulative confirmed cases in 8 key countries, 2020-02-23.
Database Design
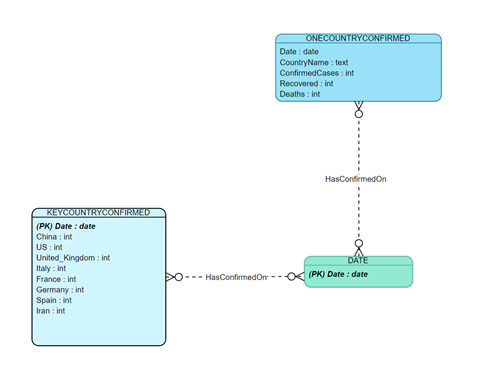
This project utilizes two datasets, countries-aggregated_csv.csv and key-countries-pivoted_csv.csv, sourced from https://datahub.io/core/covid-19. Based on these datasets, two tables were created: ONECOUNTRYCONFIRMED and KEYCOUNTRYCONFIRMED. Their attributes and relationships are illustrated in the entity-relationship diagram (ERD) below (Fig. 2). The database schema adheres to the first normal form (1NF), ensuring high query efficiency. The user-entered date serves as a foreign key and a constraint for querying records across tables.
 Figure 2: ERD of the tables
 DATE, ONECOUNTRYCONFIRMED, and KEYCOUNTRYCONFIRMED, showing many-to-many (M:N) cardinality constraints.
Input
Users need to enter a date in the format YYYY-MM-DD, which must be between 2020-01-22 and the current date.
Output
- The interface displays the country with the highest cumulative confirmed cases as of the specified date and the corresponding case count.
- An HTML-based heat map is generated in the same directory as the Python code, visualizing COVID-19 case numbers in eight key countries (China, the US, the UK, Italy, France, Germany, Spain, and Iran).
Limitations
The project has some redundancy since it only meets 1NF, leading to overlapping confirmed case data in both tables. However, due to inconsistencies in data sources, merging the tables is not straightforward (e.g., values in ONECOUNTRYCONFIRMED.ConfirmedCases cannot directly replace those in KEYCOUNTRYCONFIRMED).
User interaction is currently minimal. Although the heat map provides intuitive visualization, it is disconnected from the main user interface, leading to a suboptimal user experience. Future improvements could integrate the visualization more seamlessly into the interface.
Source Code
https://github.com/Jiachuan-Wang/DatabaseMini-project
Acknowledgements
Thanks to Dr. Wanlu Liu for teaching SQL and the code about psycopg2 and pygame. Thanks to Jincheng and Xiaotian for their help.